ohsome quality API (OQAPI)
What is the ohsome quality API (OQAPI)
The emergence of Volunteered Geographic Information (VGI) and platforms like OpenStreetMap (OSM) have demonstrated their worth in various scenarios. They range from providing real-time mapping during natural disasters in affected areas to enhancing cartographic context in regions with limited mapping coverage. Moreover, all these contributions are readily accessible to end users, humanitarian organizations, and public administrations without any cost.
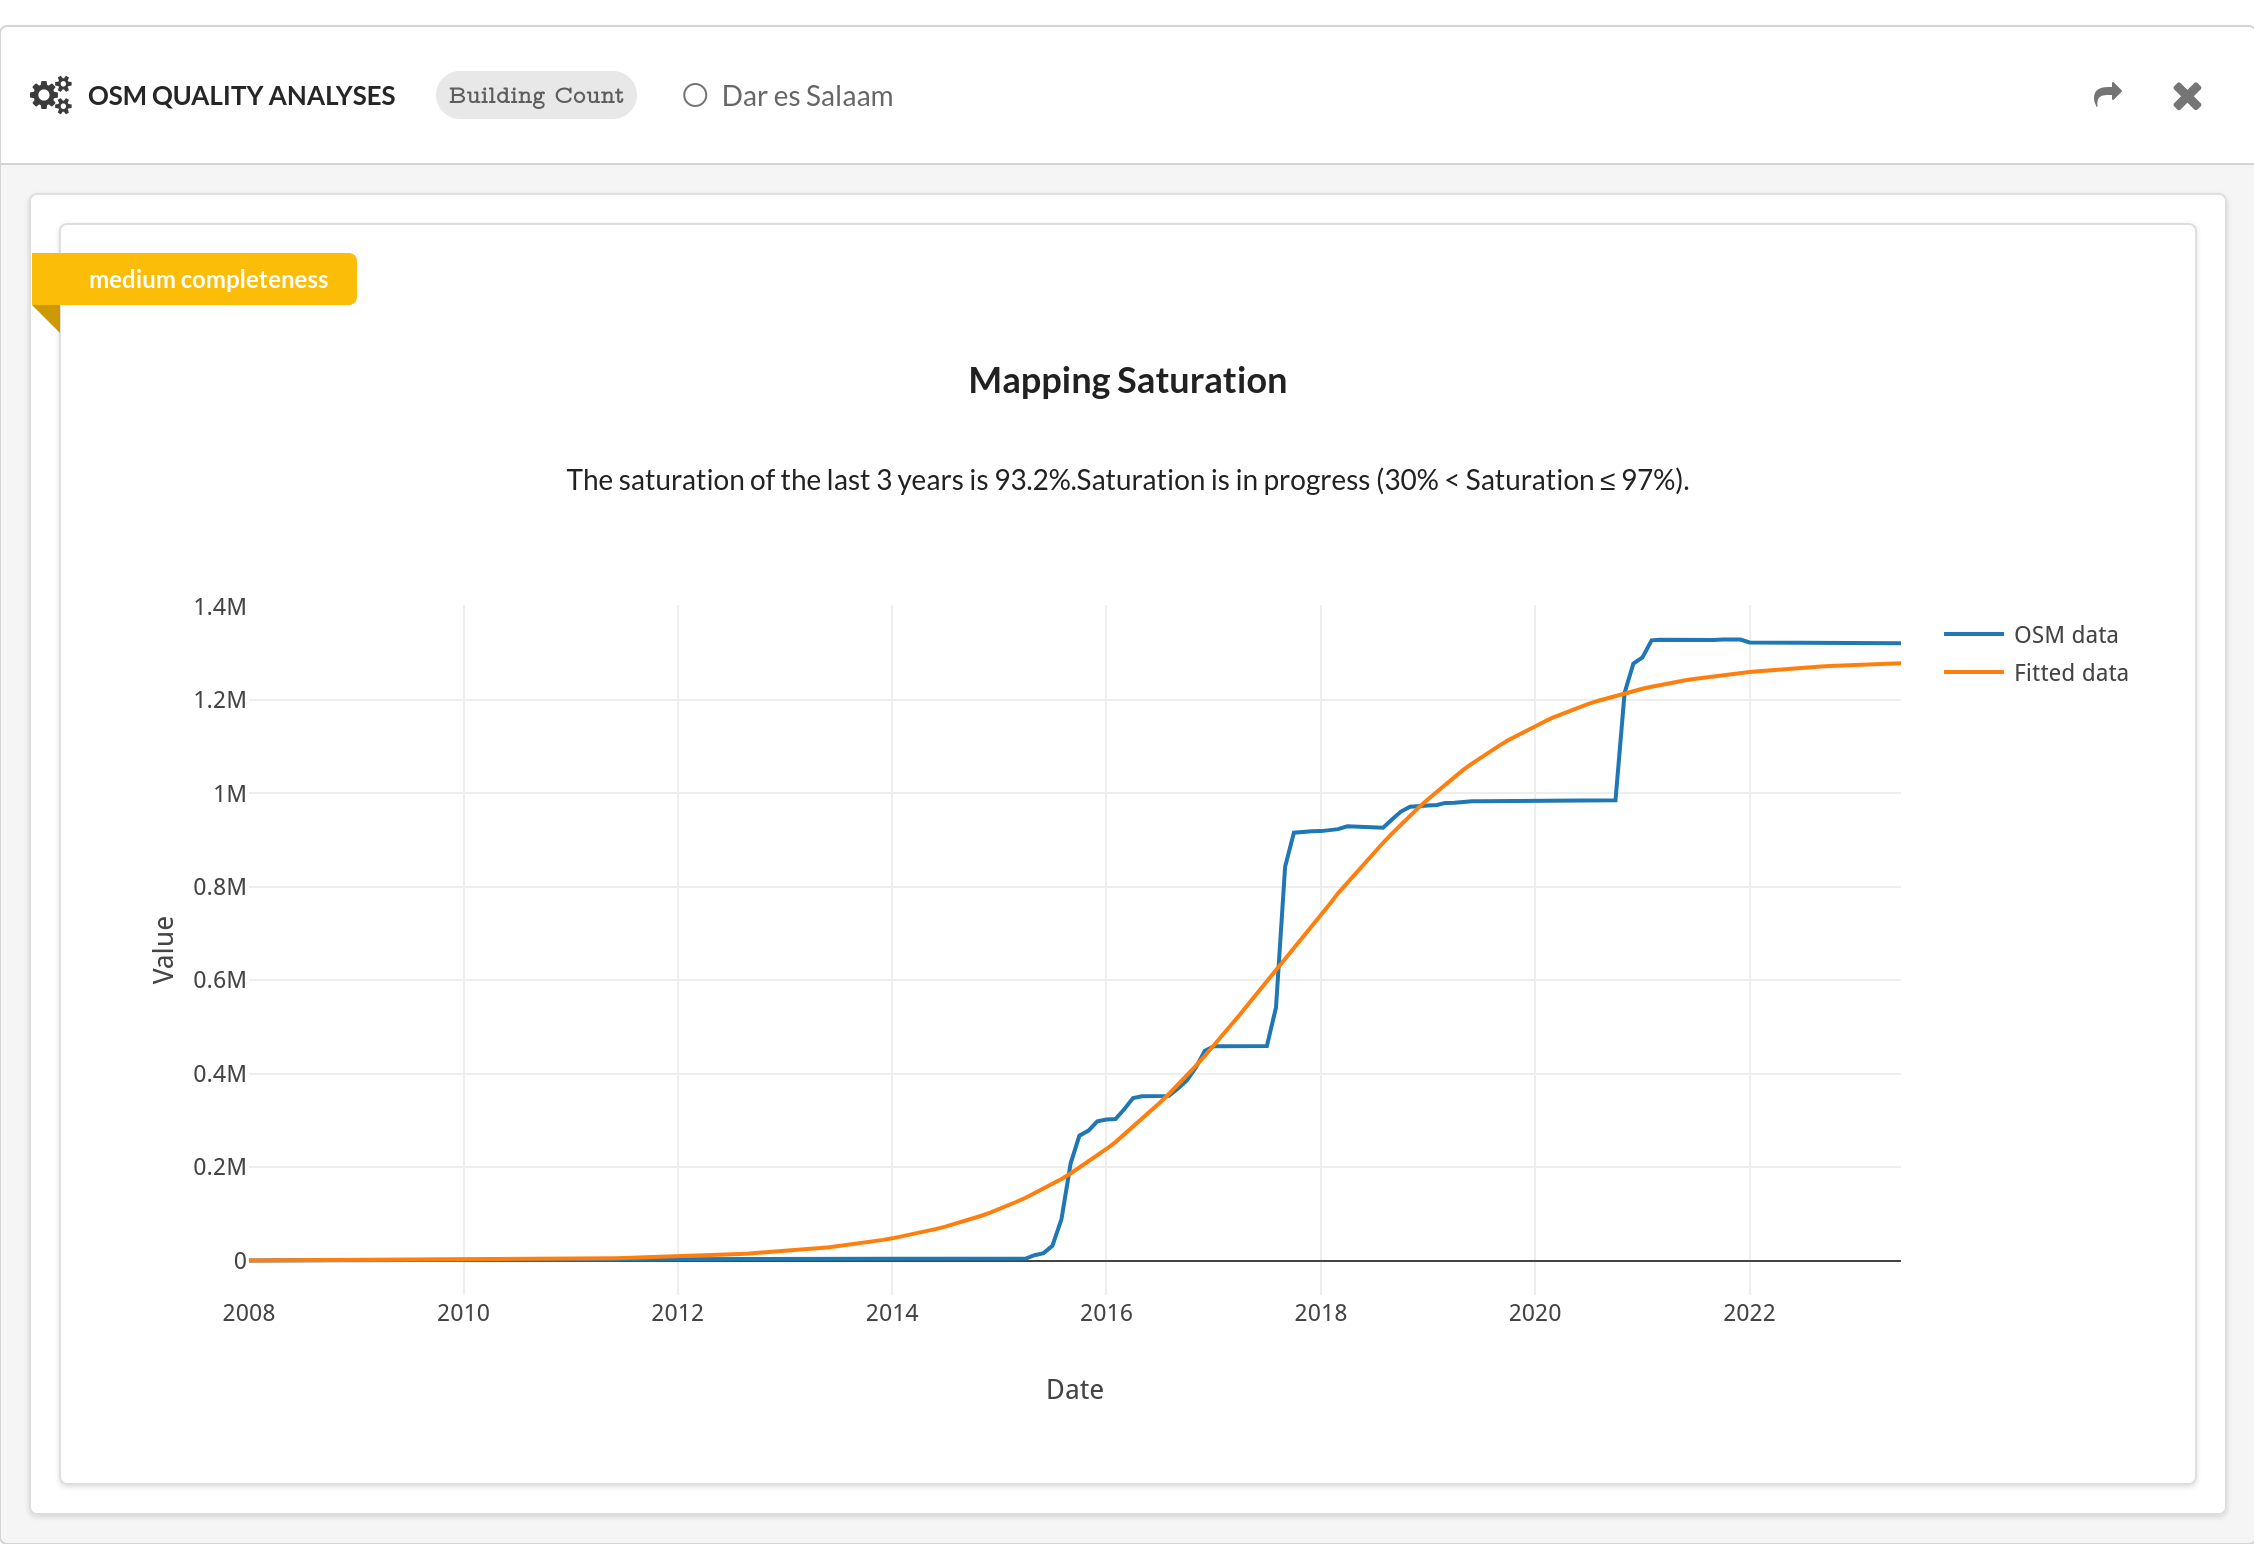
However, one of the major sticking points for using OSM in those contexts is data quality. The question is always: Is OSM data good enough for my specific use case and within my area of interest? Our goal with OQAPI is to tackle this question by computing indicators of various quality dimensions and make those easily accessible. Both intrinsic, such as looking at the history of contributions, and extrinsic, such as comparing the data with an external dataset, methods are used to derive statements about quality. Results are classified into three categories: low, medium and high quality. A textual and figuratively explanation.
OQAPI builds upon existing OSM analysis infrastructure at HeiGIT, in particular the ohsome API and the OSHDB to analyze OSM history.
As an open source project, all the code for OQAPI is accessible on Github, and you can stay up-to-date on its advancements by reading our blogposts.
How to use OQAPI
Dashboard
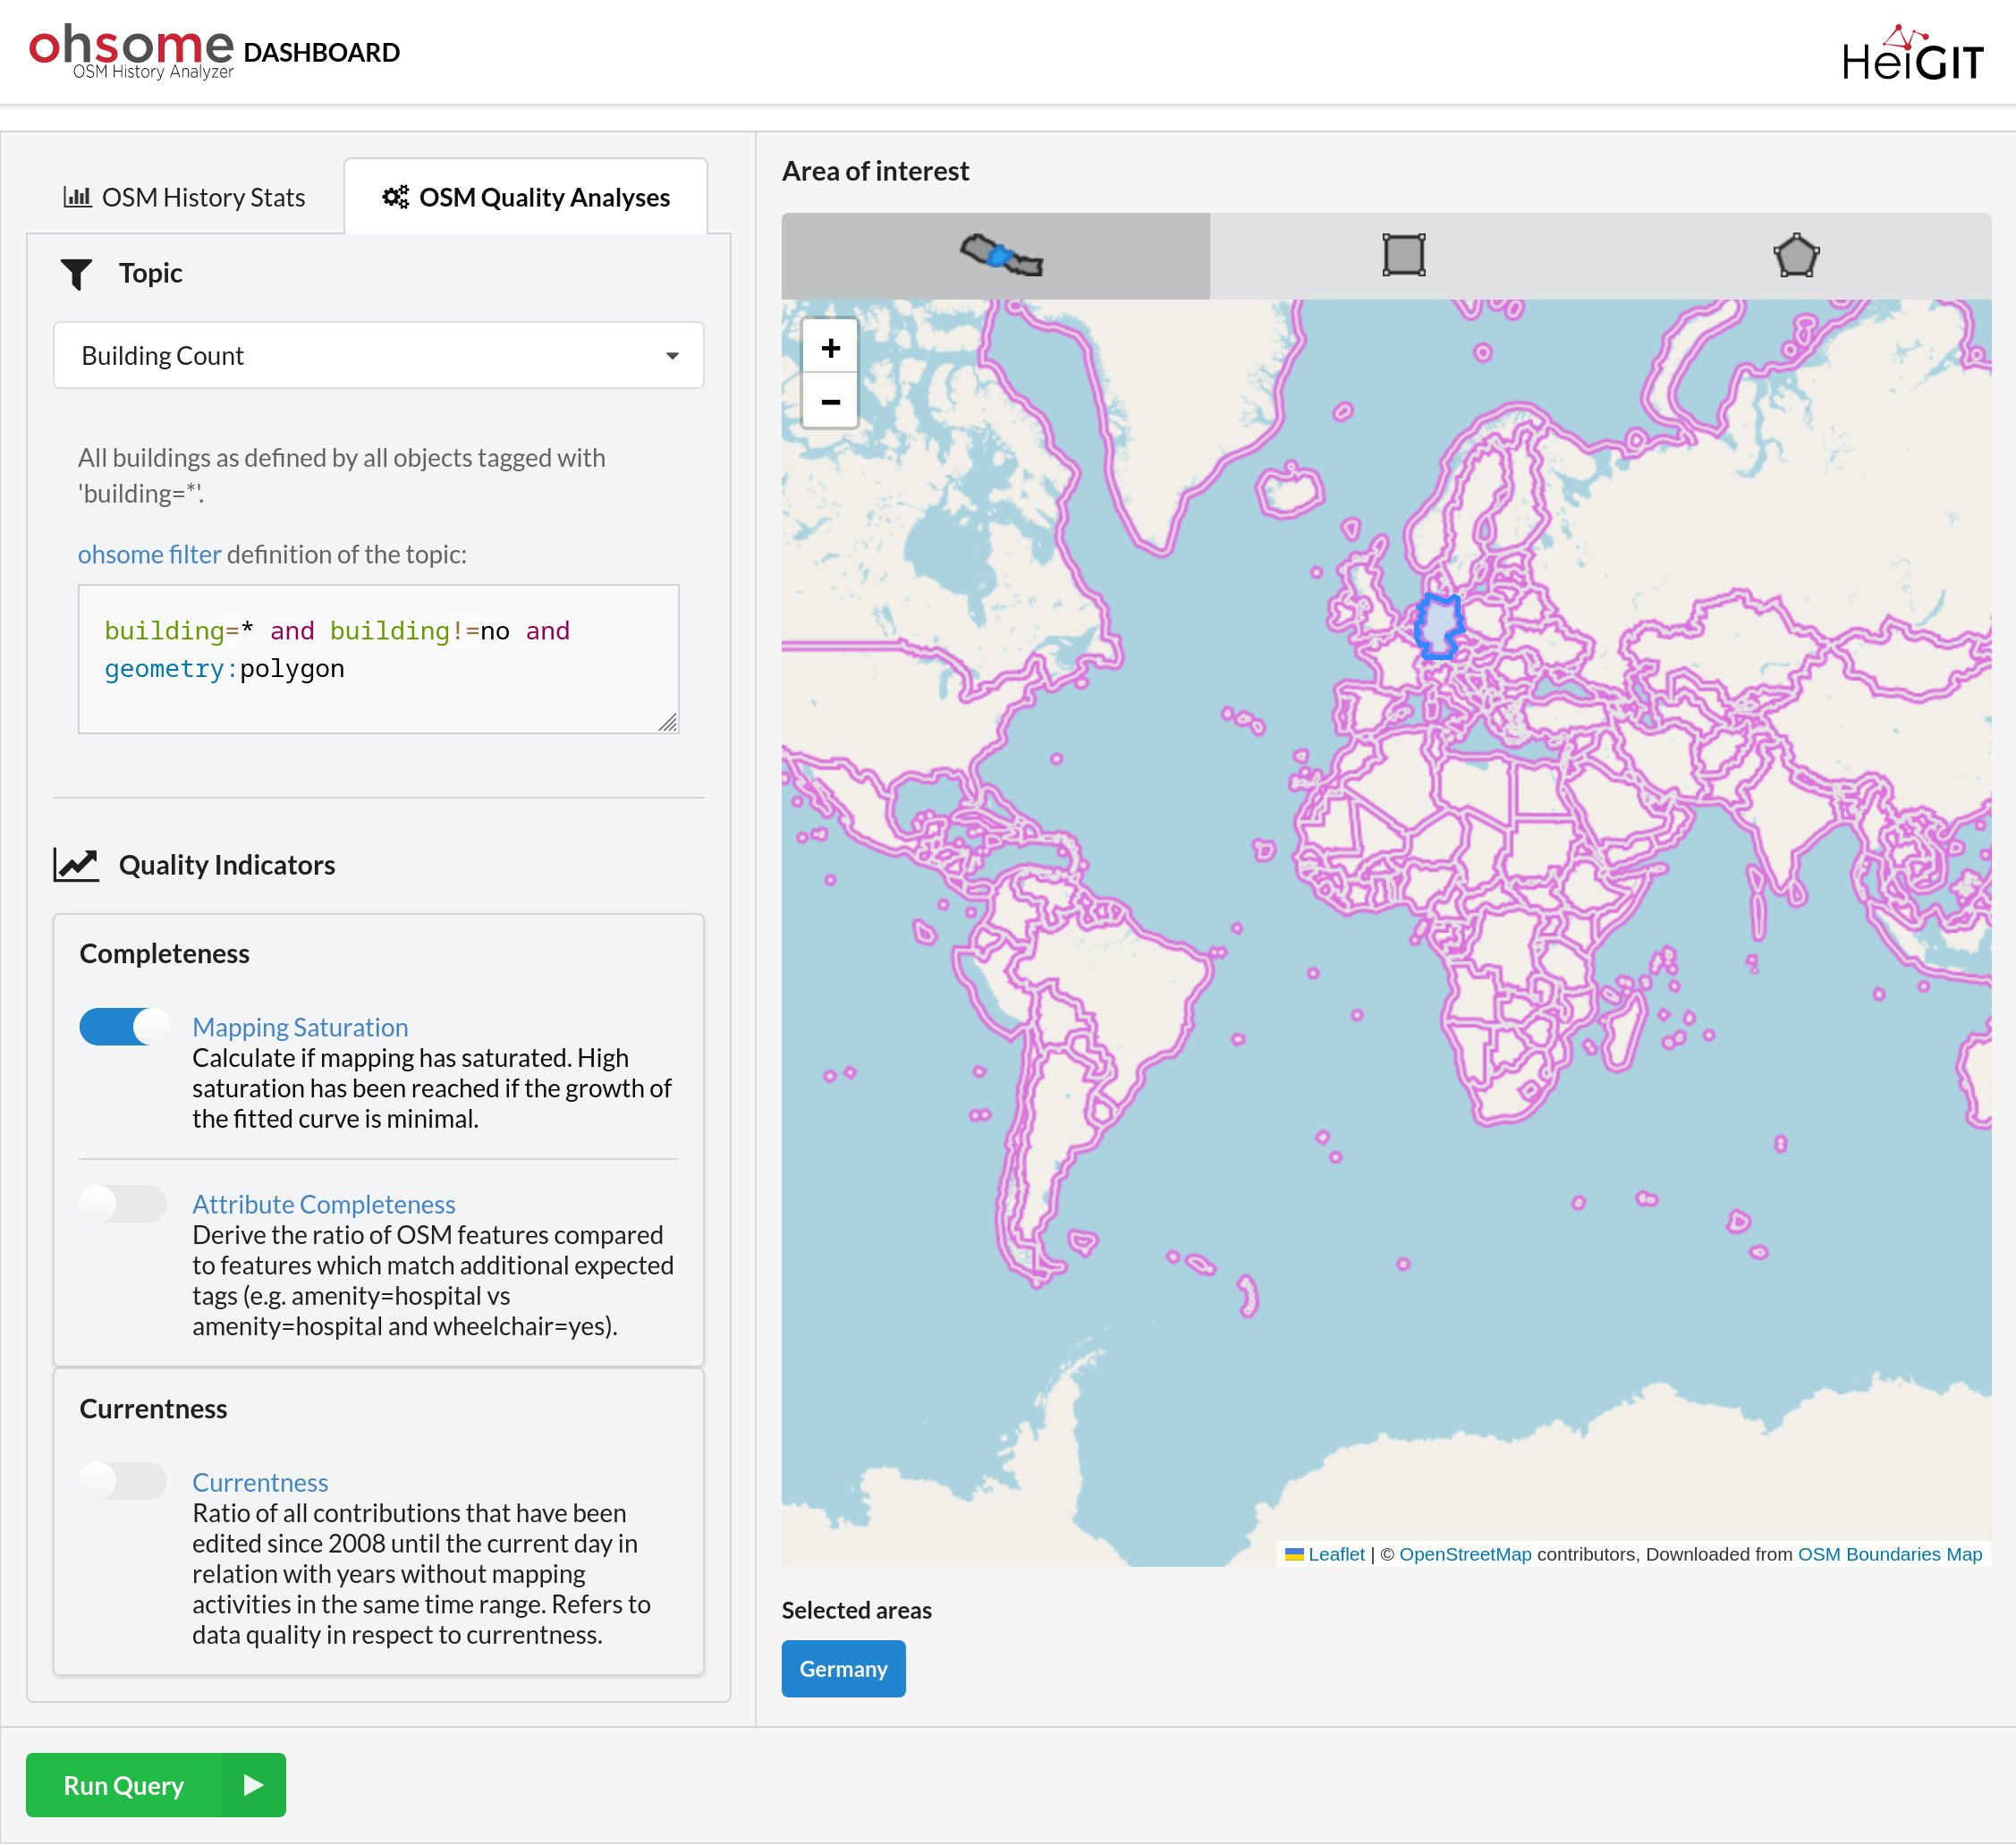
For quick insights, you can start exploring OQAPI through the ohsome dashboard.
API
To compute indicators programmatically, we provide an API. Check out the interactive API documentation and examples.